What’s Driving Discontent? How Age, Politics, and Religion Shape Americans’ Views of Democracy
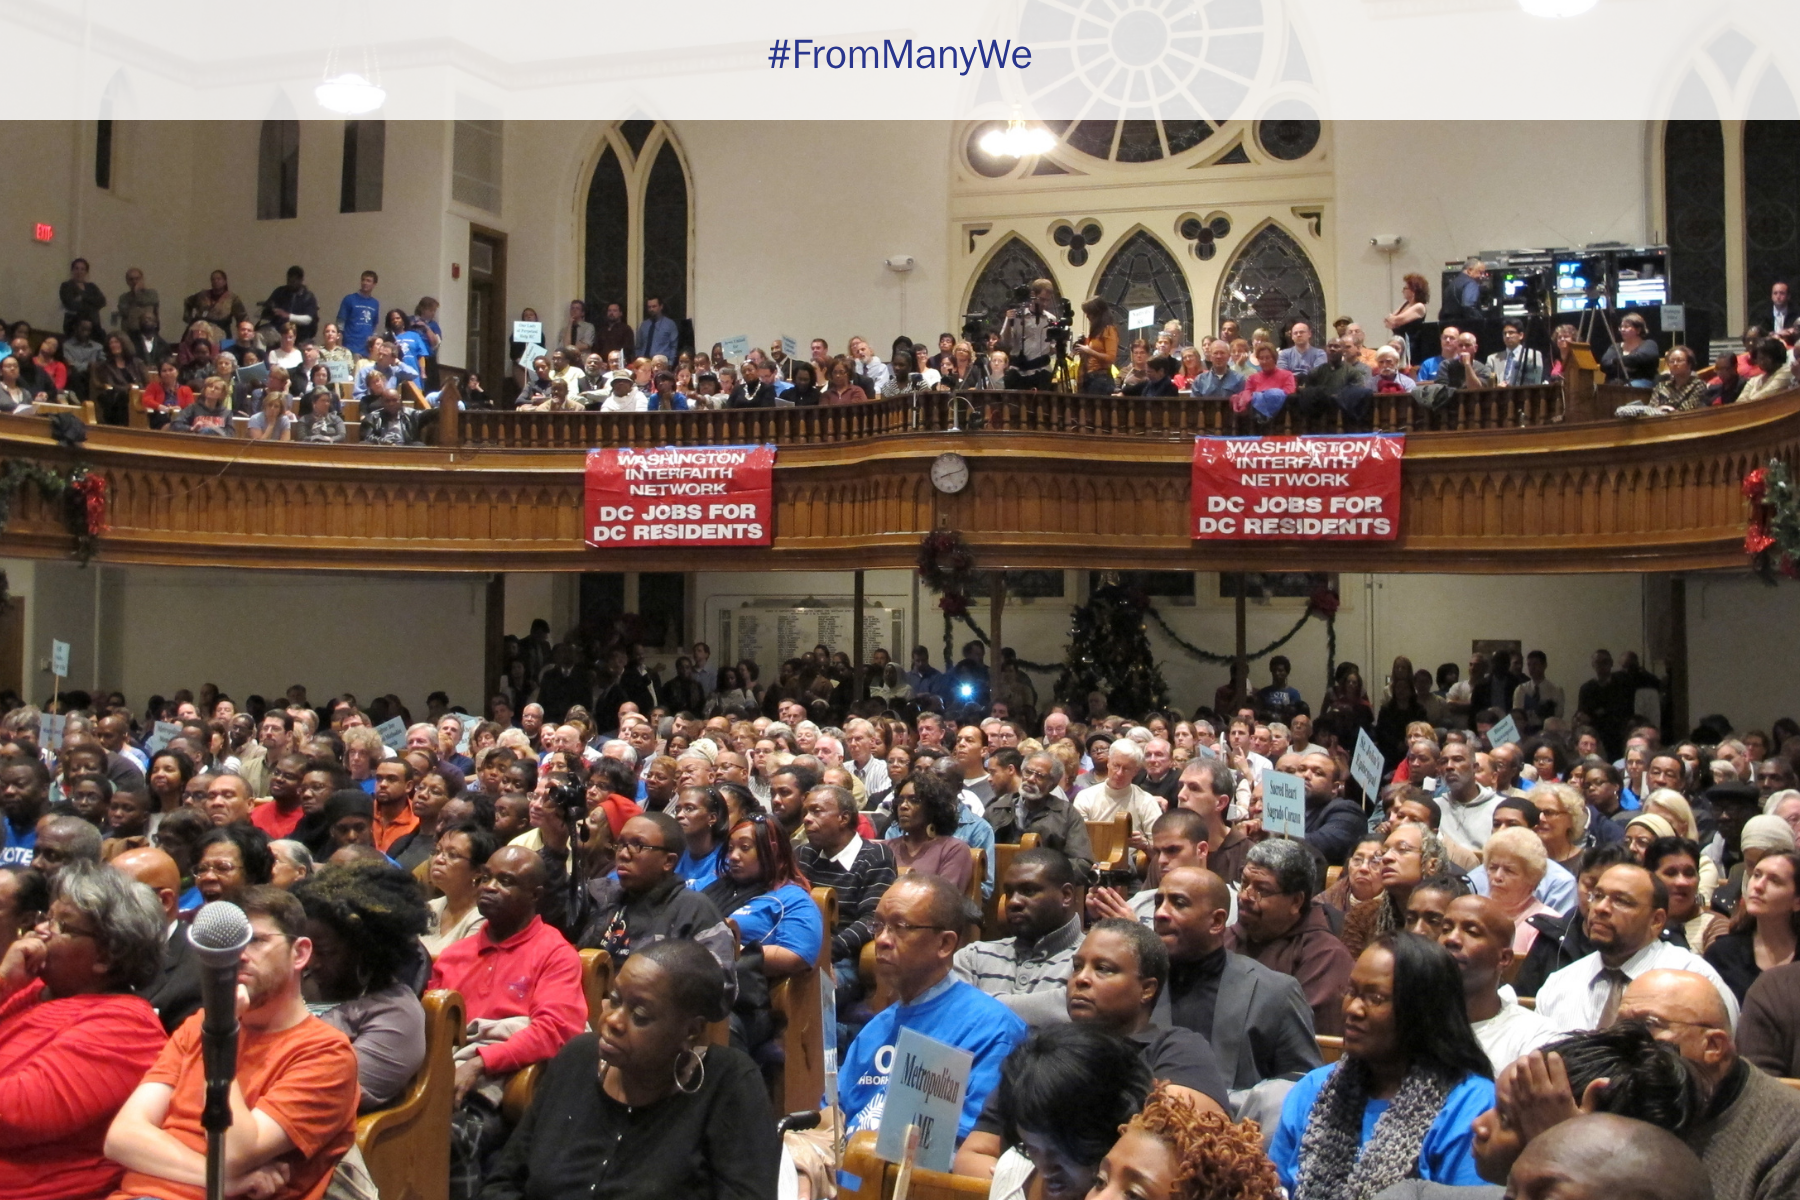
Photo by Hamil Harris/The Washington Post via Getty Images.
The Democracy for All Project is a multiyear collaboration between the Kettering Foundation and Gallup. This annual, national survey is designed to understand how Americans experience democracy and elevate all voices across groups and generations. This article discusses data from surveys of 20,338 adults conducted between July and August 2025, with a margin of sampling error of ±0.9 percentage points.
In the last year alone, expert surveys, such as those done by Varieties of Democracy Institute and Freedom House, show the health of democracy in the United States is on a continued downward trajectory. Americans are also sensing this weakening of democracy in the US.
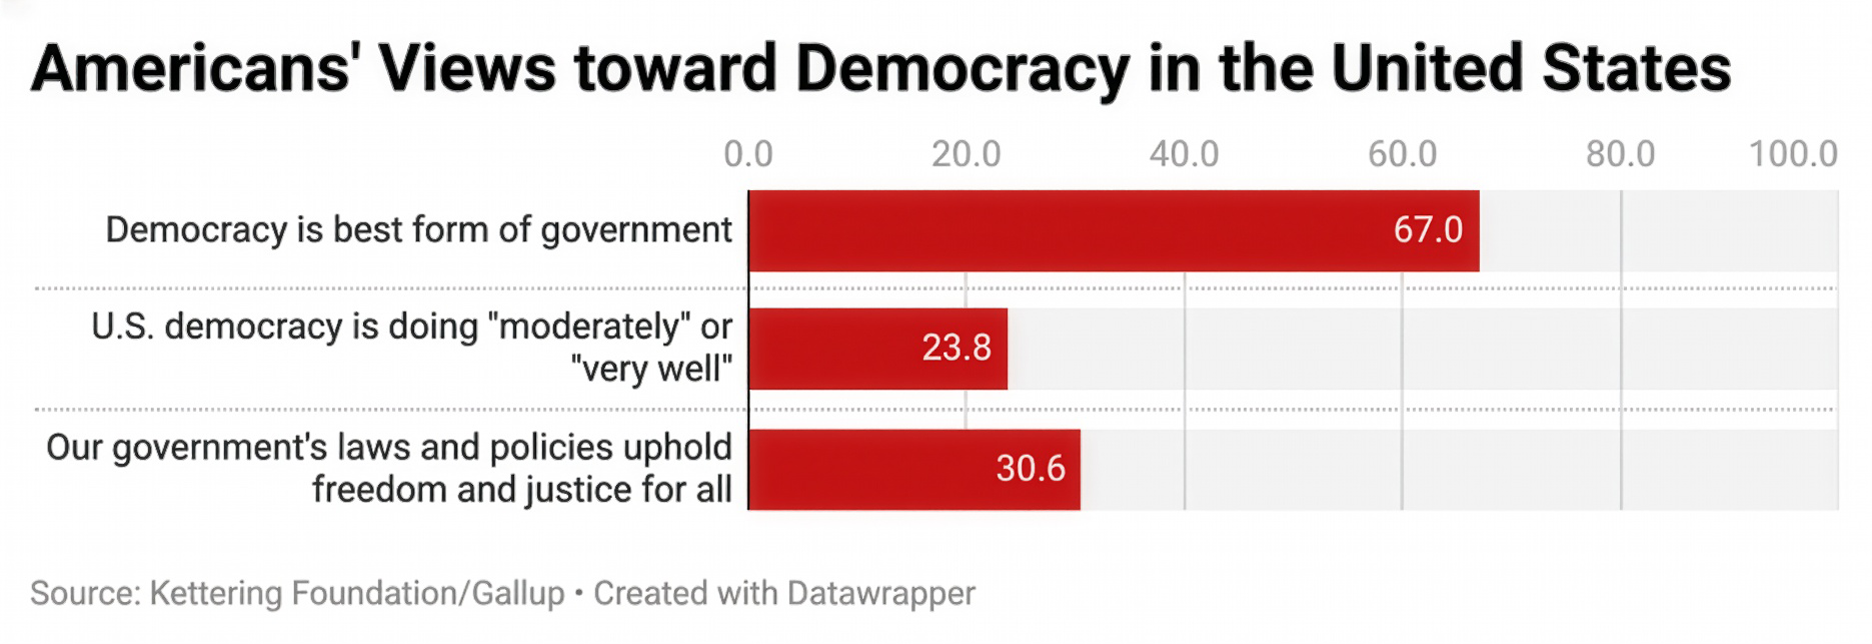
According to the 2025 Democracy for All Project from the Kettering Foundation and Gallup, two-thirds of Americans agree that “Democracy is the best form of government.” Americans are much more pessimistic, however, on whether democracy is currently flourishing in the United States. Just under 24% believe US democracy is doing “moderately” or “very well,” despite what they may think about current political leadership. And only 30.6% agree or strongly agree that “Our government’s laws and policies are careful to uphold freedom and justice for all.” These data points suggest that there is a stark contrast between how Americans view democracy in the abstract and how it presently exists.
Three Explanations
Hidden within these numbers, however, is variation across the population according to demographic differences. Political partisanship is one obvious explanation, but the 2025 Democracy for All Project survey allows us to explore other possible factors shaping Americans’ experiences of democracy.
Explanation #1: Generational Differences. As seen in the table below, while two-thirds of Americans believe democracy is the best form of government, there are dramatic differences across generations. Gen Z is least likely to agree with this statement (54%) while Baby Boomers (78%) and the Silent Generation (89%) are most likely to agree. Gen Z is again least likely to believe US democracy is doing “moderately” or “very well,” but the differences compared to other generations are much less stark. The same is true for the belief that our laws and policies uphold freedom and justice for all.
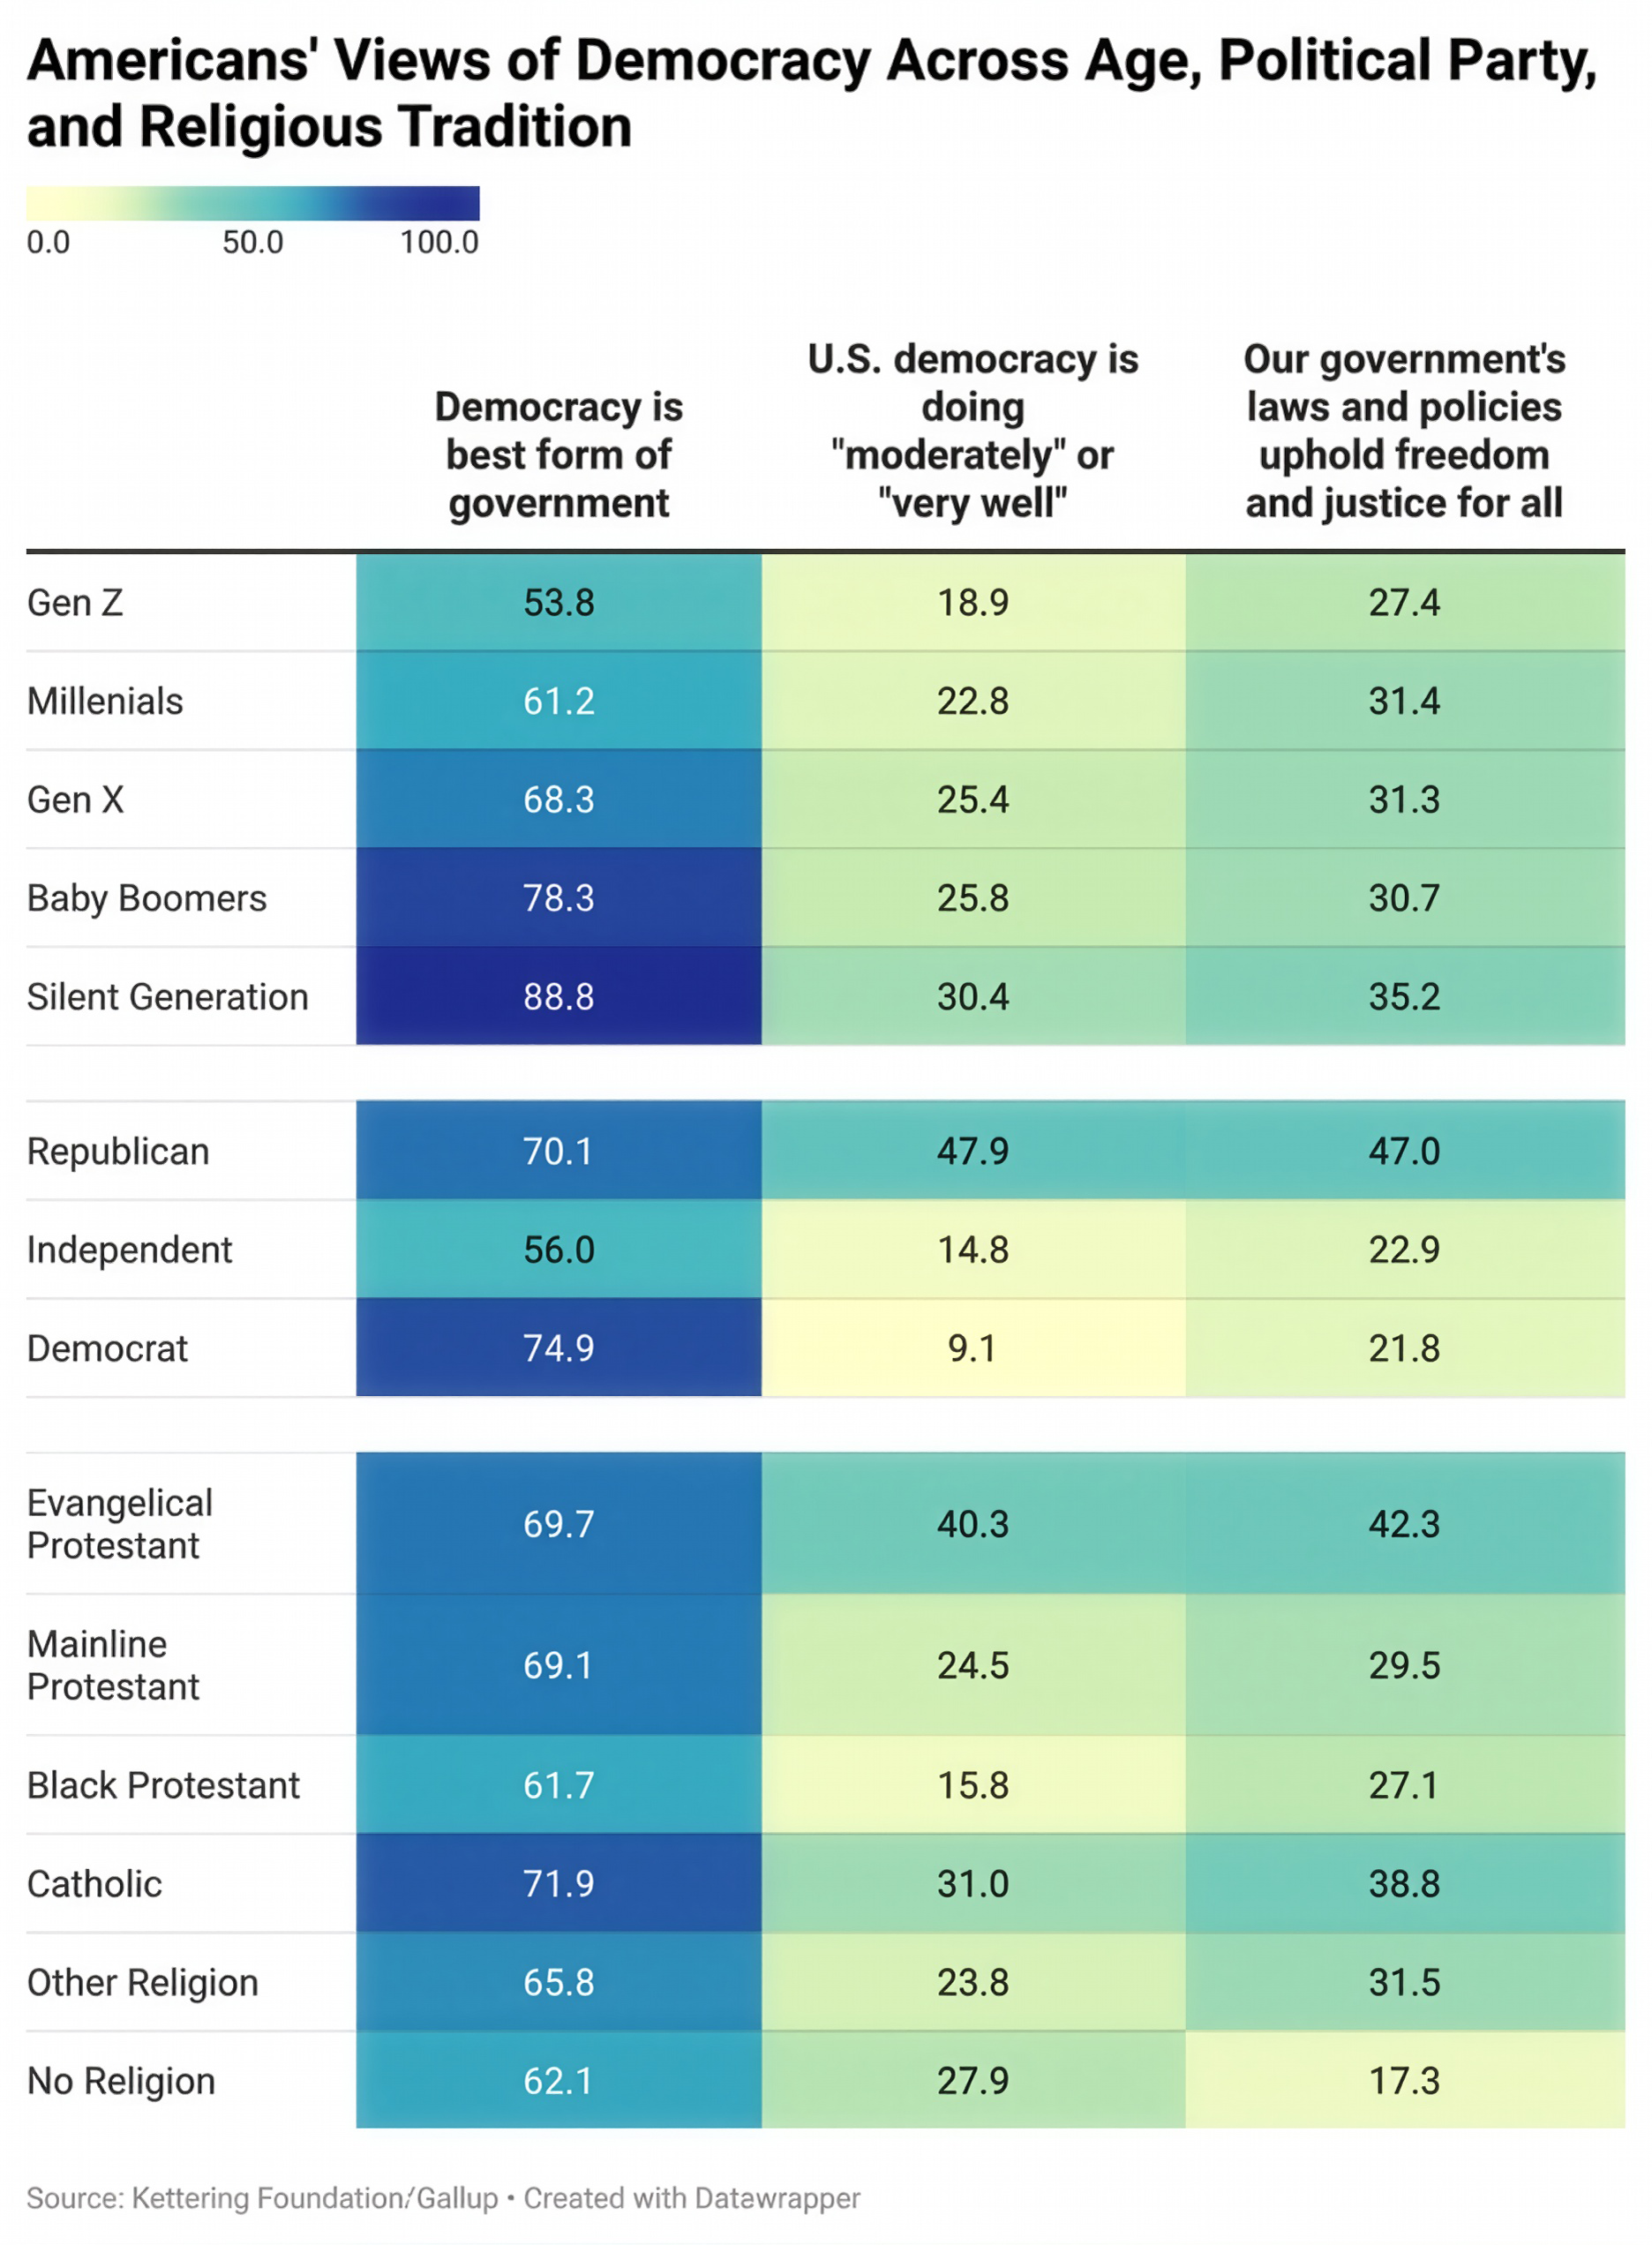
Explanation #2: Political Party Affiliation. Another likely explanation for dissatisfaction with democracy is political partisanship. Americans’ views of the direction of the country consistently flip depending on if the president in office shares their political affiliation. However, if partisanship alone drives support for democracy, we would expect to see the biggest differences between Republicans and Democrats. Both Republicans (70%) and Democrats (75%) agree democracy is the best form of government. Independents (56%) are the least convinced. The hypothesis of Republicans being on one end of the spectrum and Democrats on the other fails in this instance.
However, when asked whether US democracy is doing “moderately” or “very well,” or if “Our government’s laws and policies are careful to uphold freedom and justice for all,” Republicans and Democrats are on opposite ends. However, more young voters identify as Democrats, so the differences that appear to be based on age could actually be due to party.
Forty-eight percent of Republicans believe democracy in the US is doing well compared to just 15% of Independents and only 9% of Democrats. Forty-seven percent of Republicans believe our laws uphold freedom and justice for all, while only 23% of Independents and 22% of Democrats answer similarly. Again, these results are unsurprising as views of US democracy across political party often hinge on which political party is occupying the White House.
Explanation #3: Religious Affiliation. Religion is a third consideration for the differences among Americans concerning the health of democracy in the US. As the table above shows, when asked about whether democracy is the best form of government, between 60–70% of each religious group agrees it is, including Americans who are unaffiliated, labeled “No Religion.”
However, like political party affiliation, more differences emerge when asked about the state of democracy. Over 40% of Evangelical Protestants, the highest of all religious groups, believe US democracy is doing well and that our laws and policies uphold freedom and justice for all. Catholics are the next highest on both questions, with Mainline Protestants following. Black Protestants (16%) are the least likely to believe US democracy is doing well. Americans of No Religion (17%) are least likely to agree our laws and policies uphold freedom and justice for all.
Determining the Relative Importance of Age, Politics, and Religion
Differences across generations, political parties, and religious traditions seem to shape perceptions of democracy. But are the generational differences because younger people are more likely to be Democrats? Or are Evangelical Protestants more supportive of our current political moment because more of them are Republicans? Statistical modeling helps us determine which of these explanations is still important even after we account for the influence of other possible explanations.
The first figure below shows the results of a regression model that is predicting agreement with the statement, “Democracy is the best form of government.”
The beauty of this statistical test is that the results for each possible explanation are controlling for the influence of all other explanations included in the model. So, if we find that being a Republican is linked with a greater likelihood of agreement, that relationship exists even when we account for someone’s race, gender, education level, income level, religious tradition, or age.
Here’s how to read the results: If the horizontal blue bar for a row is entirely to the right of the vertical dotted red line, it means people in this group are more likely to agree with the statement “Democracy is the best form of government.” If the horizontal blue bar for a row is entirely to the left of the vertical dotted red line, it means people in this group are less likely to agree. If any part of a horizontal blue bar intersects with the vertically dotted red line, it means this measure has no discernible effect.
An important note: the generational categories (Millennial, Gen X, Baby Boomers, Silent Generation) are all being compared to respondents who are Gen Z, while party categories of Democrat and Independent are each being compared to Republicans, and the religious tradition categories are all being compared to Evangelical Protestants. Any of the groups could be a control group or an excluded category. The results would change as the groups in the figure would then all be compared to the different excluded category. This figure is not showing whether Baby Boomers are different from Gen X, or if Democrats are different from Independents.
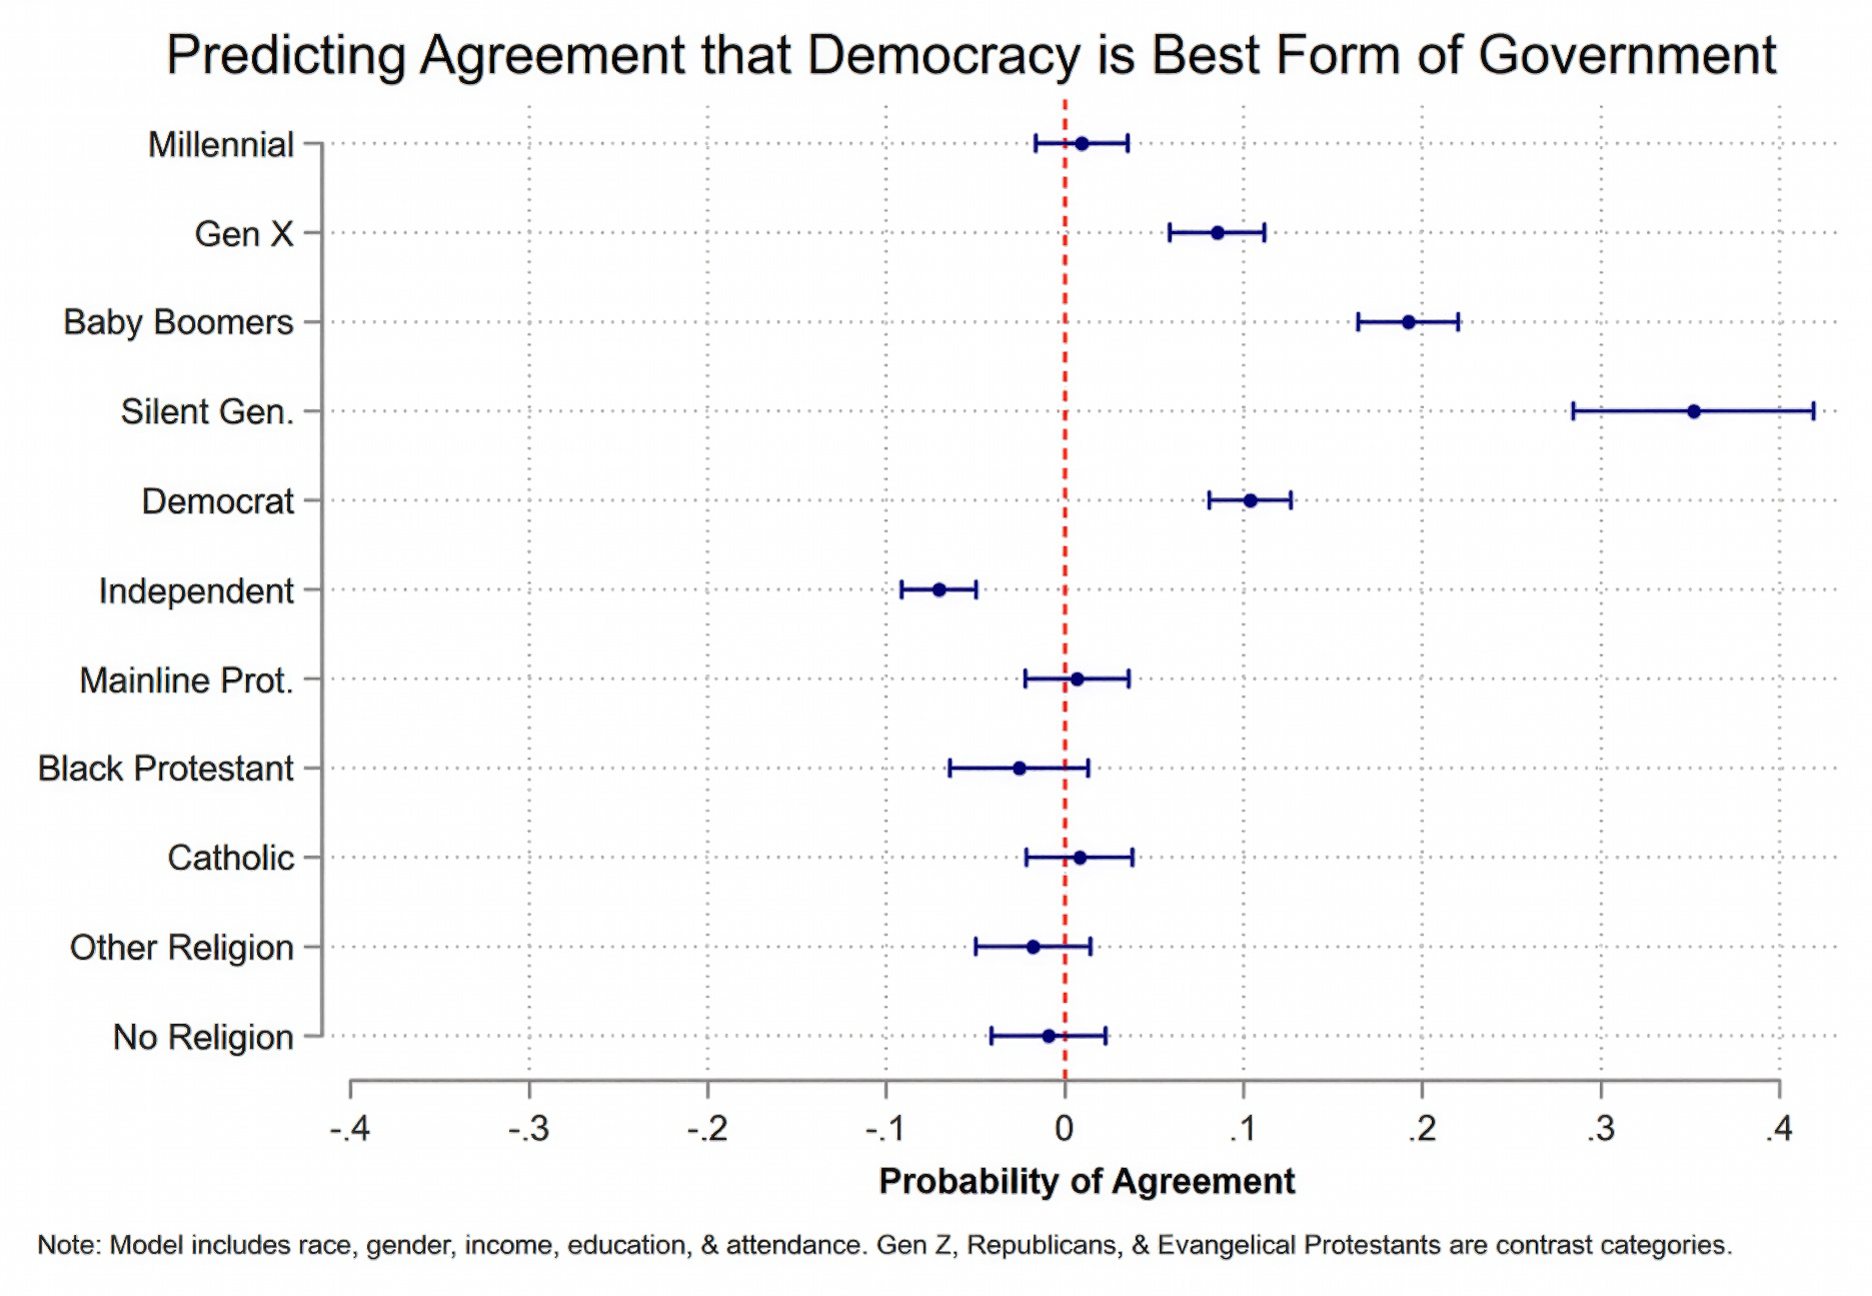
As we see in the figure above, even when we account for respondents’ political party and religious affiliation (including the other measures mentioned in the note), Americans in the Silent Generation, Baby Boomers, and Gen X are all more likely to agree that democracy is the best form of government compared to Gen Z. Millennials, however, are no different in their views compared to Gen Z, as seen by the horizontal blue bar intersecting with the vertical red dotted line.
For political party, we see that Democrats are more likely to agree that democracy is the best form of government when compared to Republicans. Independents, however, are less likely than Republicans to agree.
And interestingly, once we account for the influence of other possible explanations, there are no statistical differences between Evangelical Protestants and all other religious traditions. All of the horizontal blue bars for each religious tradition intersect the vertical red dotted line. The differences in percentages across religious tradition are due to other underlying factors, like generational category and political party.
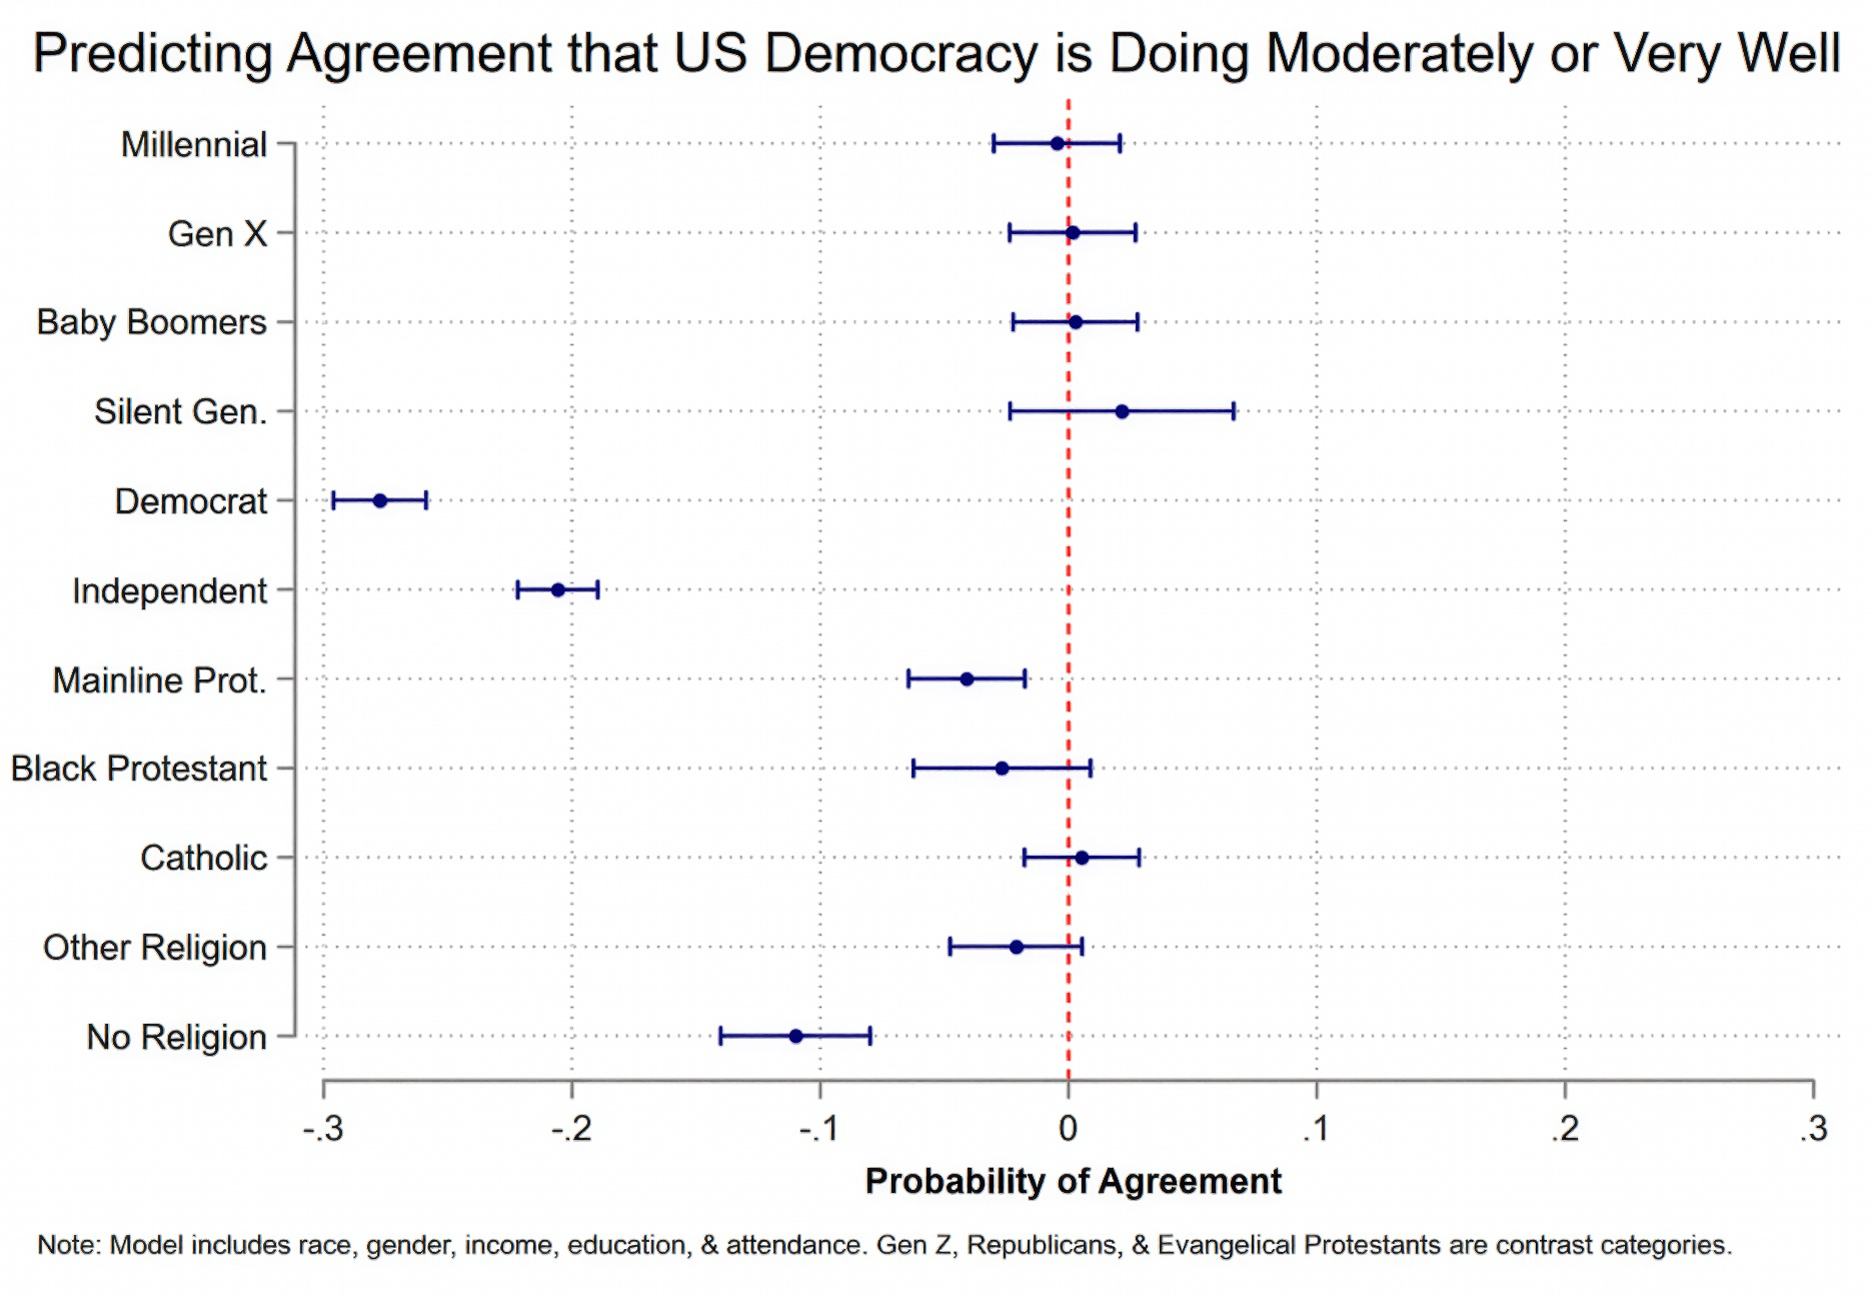
Running the same statistical test on whether Americans are likely to agree that US democracy is working well uncovers a similar finding. As we see in the figure above, all of the horizontal blue bars for each generational category intersect the vertical red dotted line. This means that Gen Z respondents are no different in how they are answering this question compared to older generations. This is markedly different than the first figure.
Both Democrats and Independents, however, are much less likely to agree US democracy is working well when compared to Republicans. And remember, this dramatic difference across political parties is present even when we account for many other possible explanations.
However, partisanship is not the only factor. Mainline Protestants and those with No Religion are both less likely than Evangelical Protestants to agree US democracy is doing well. The other religious traditions are no different than Evangelicals.
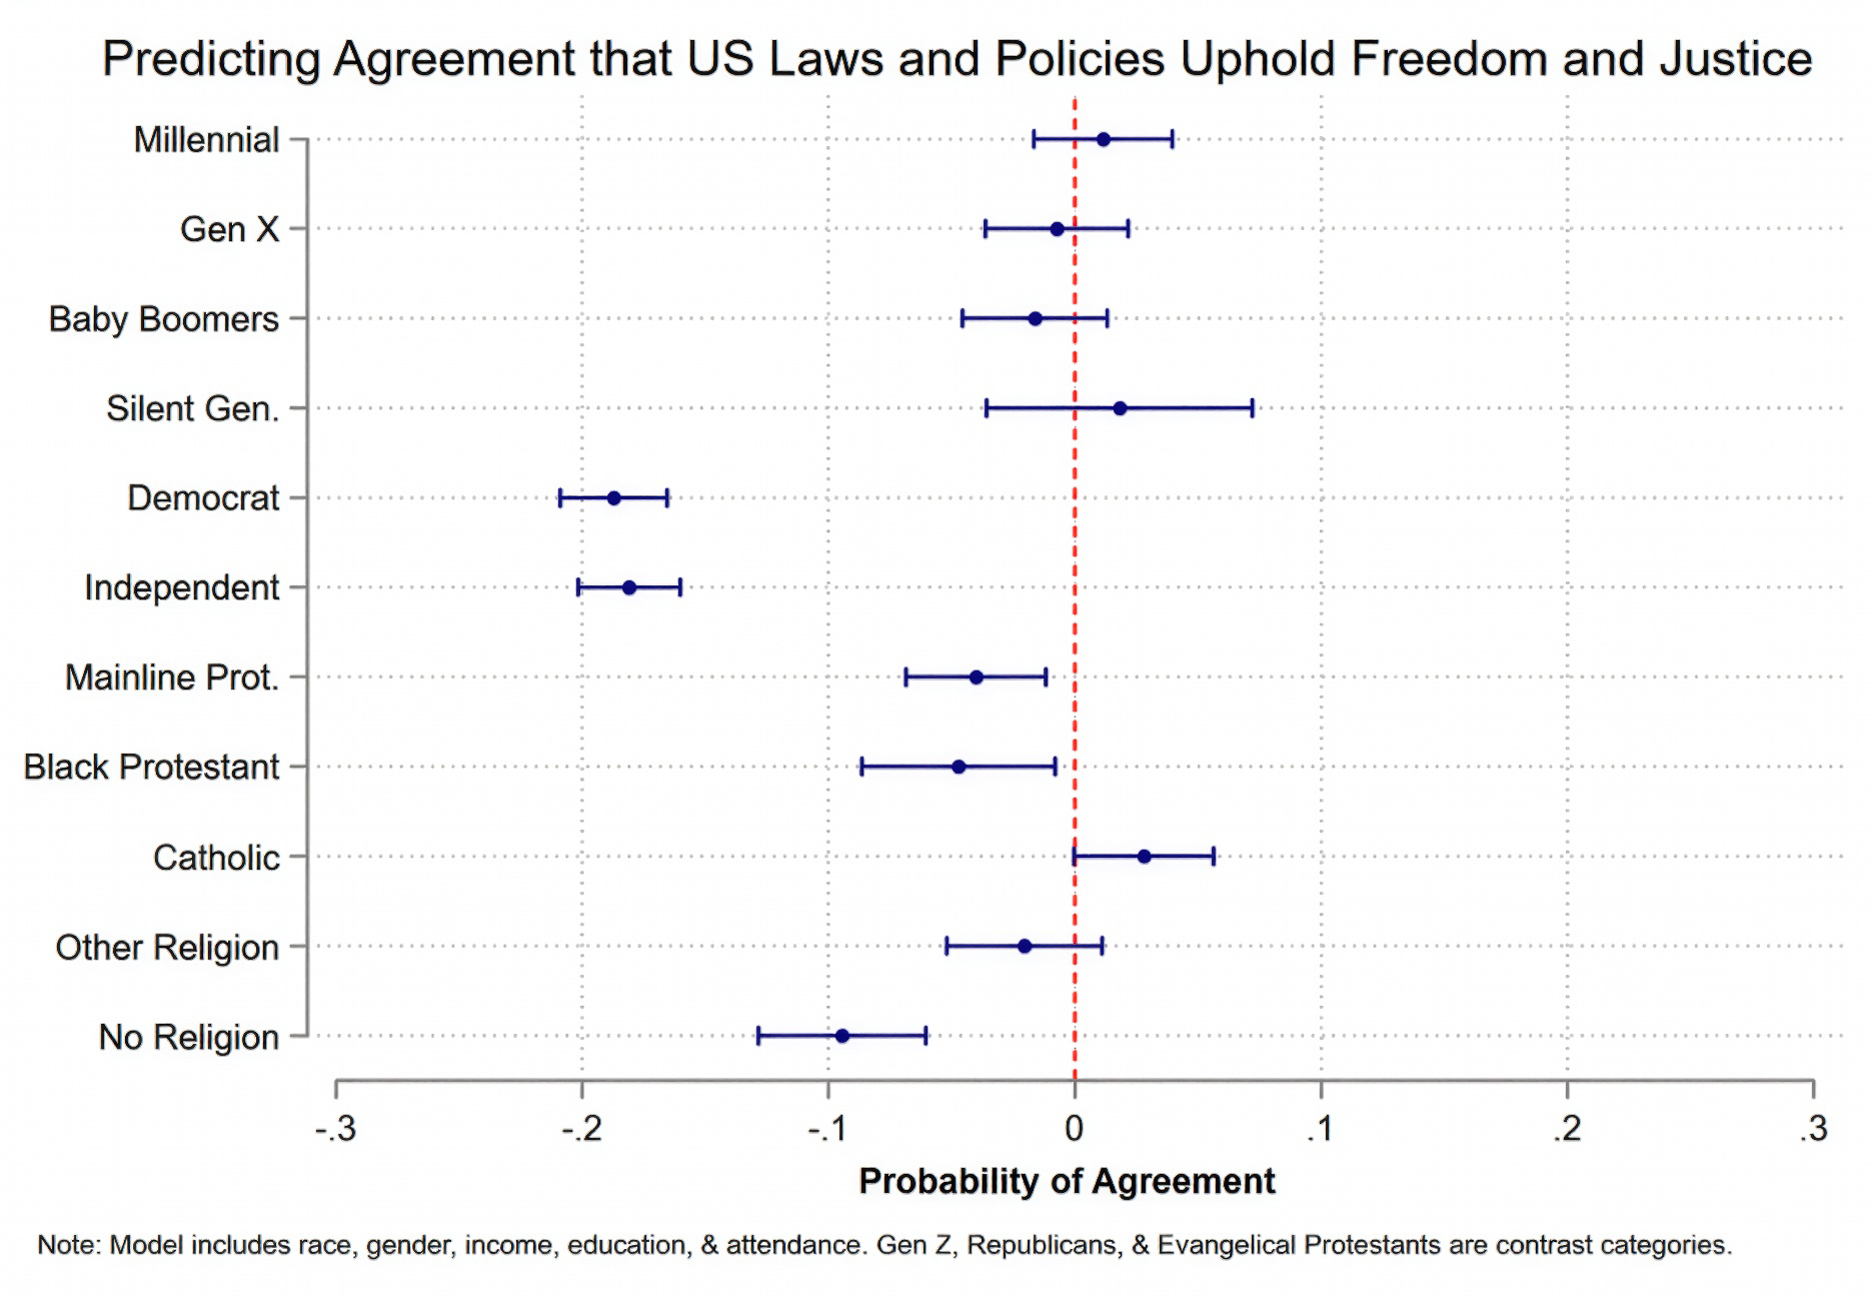
Focusing on the likelihood of agreement that our laws and policies uphold freedom and justice for all, there are again no meaningful differences between Gen Z respondents and older generations. Democrats and Independents are less likely to agree our laws and policies uphold freedom and justice for all when compared to Republicans. And Mainline Protestants, Black Protestants, and those with No Religion are all less likely to agree with this statement when compared to Evangelical Protestants.
Taken together, these statistical tests help us see that the different views of democracy that exist across generations, political parties, and religious traditions are sometimes genuine and at other times due to the influence of other underlying explanations.
When we imagine how or why some Americans might have a dim view of democracy, we need to be aware that there are multiple reasons why that might be, and those reasons may not be the most obvious on the surface.
It is imperative we continue to gather and analyze quality data to understand what is true about our collective reality so we can best collectively respond to the current political and social moment in defense of democracy.
Andrew L. Whitehead is professor of sociology at Indiana University Indianapolis, codirector of the Association of Religion Data Archives, and a Charles F. Kettering Foundation Research Fellow. Follow him on Bluesky and Substack.
From Many, We is a Charles F. Kettering Foundation blog series that highlights the insights of thought leaders dedicated to the idea of inclusive democracy. Queries may be directed to fmw@kettering.org.
The views and opinions expressed by contributors to our digital communications are made independent of their affiliation with the Charles F. Kettering Foundation and without the foundation’s warranty of accuracy, authenticity, or completeness. Such statements do not reflect the views and opinions of the foundation which hereby disclaims liability to any party for direct, indirect, implied, punitive, special, incidental, or other consequential damages that may arise in connection with statements made by a contributor during their association with the foundation or independently. The views and opinions expressed by contributors are likewise made independent of their affiliation with Gallup and without Gallup’s warranty of accuracy, authenticity, or completeness. Such statements do not reflect the views and opinions of Gallup, which hereby disclaims any association with or endorsement of such content.